Speed Stats
Speed variance and crash risk
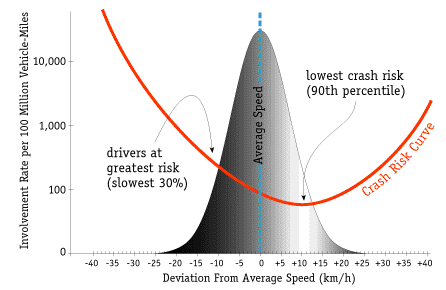
This graph shows that crash risk is minimized for those drivers travelling 10-15 km/h over the average speed. (Average speeds in BC are almost always over posted speeds.) Contrary to popular belief, there are more crashes at slower speeds than at faster speeds.
Raw speed and crash risk are not directly related, however, there is a U-shaped relationship which shows few fast drivers involved in crashes, and many more slow drivers involved in crashes.1
BC speed limits target safe drivers
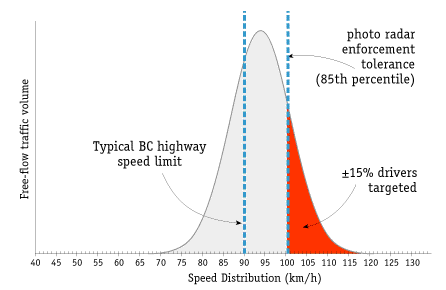
Under current BC speed limits, safe drivers are included within the red enforcement zone (the fastest 15% of vehicles). Speed enforcement should only target the top 2-5%.
Enforcement tolerances set by police are often incorrect and result in even lower tolerances.2
Proper speed limits increase safety
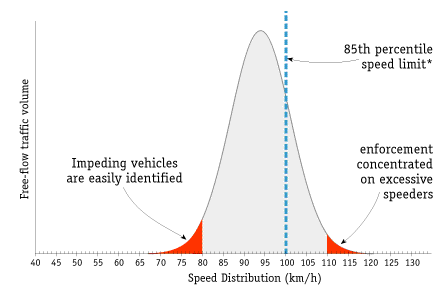
Setting speed limits according to the standards of the Institute of Transportation Engineers (the 85th percentile method) will…
* focus enforcement on dangerous drivers, not revenue collection
* increase speed limit compliance
* provide greater consistency of speed limits
* reduce speed variance resulting in reduced crashes
The 85th percentile is the speed to which 85 percent of drivers travel below (under average, free-flow conditions).
“Journalism is printing what someone else does not want printed: everything else is public relations.” – George Orwell

© 2020 SENSE BC
All rights reserved


